Interfaces
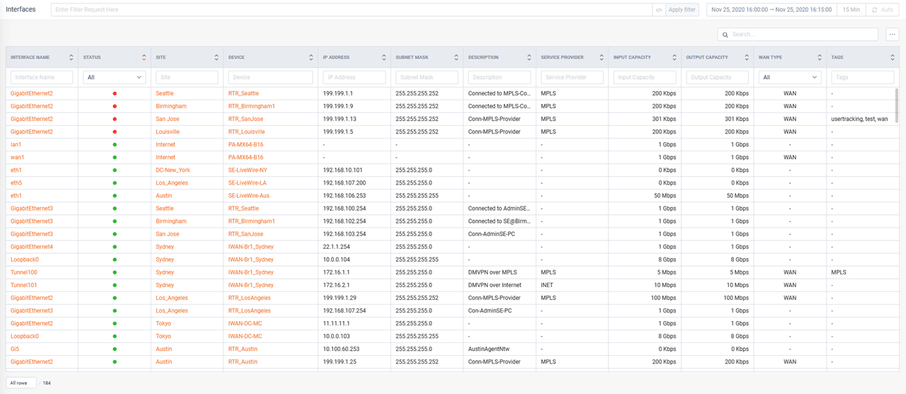
The Interface navigation page presents a list of all interfaces in LiveNX and highlights a summary of their performance statuses.
Clicking on an Interface will drill-down to the Interface’s detail page. Clicking on a Device will drill-down to the Devices' detail page. Clicking on a Site will drill-down to the Site’s detail Page.
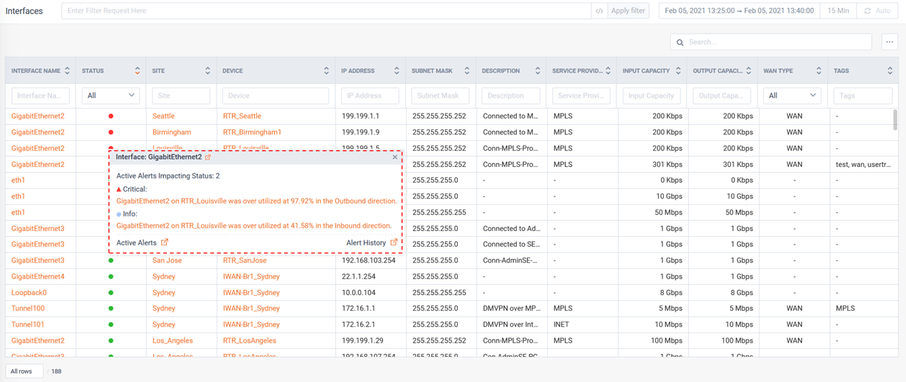
Clicking on a status bubble will provide more details and optional drill-down for further exploration.
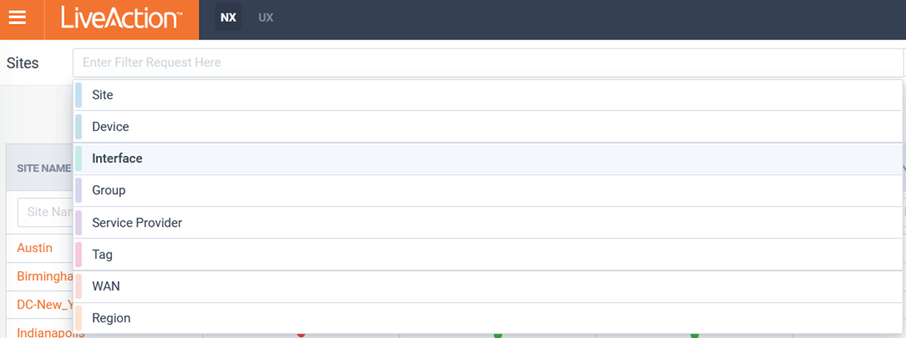
Filters can be applied to focus on the specific entities of interest:
The page can optionally be auto-refreshed by toggling the button in the top right of the page.

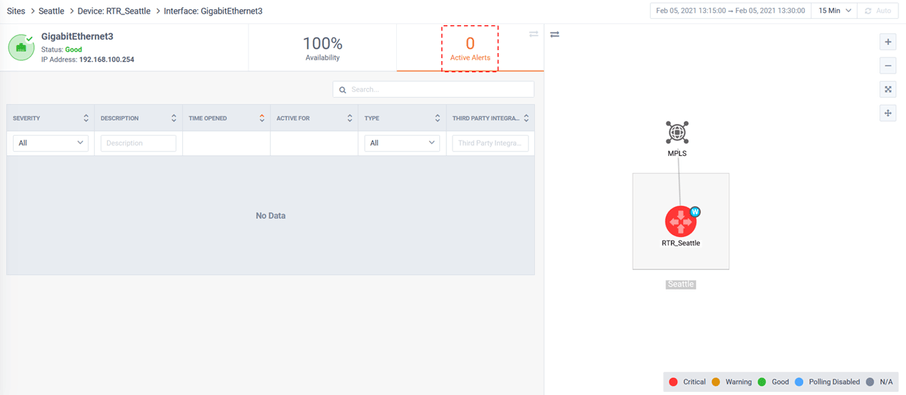
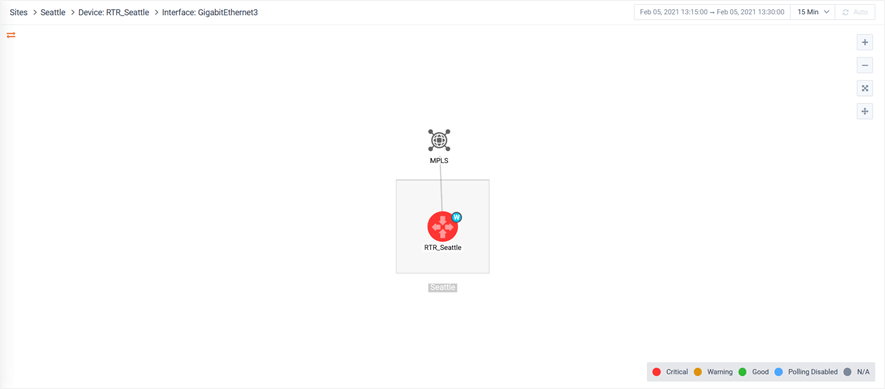
The Interface detail page has multiple tabs to quickly understand different dimensions of the entity. There is also a simple topology map to provide context of the entity.
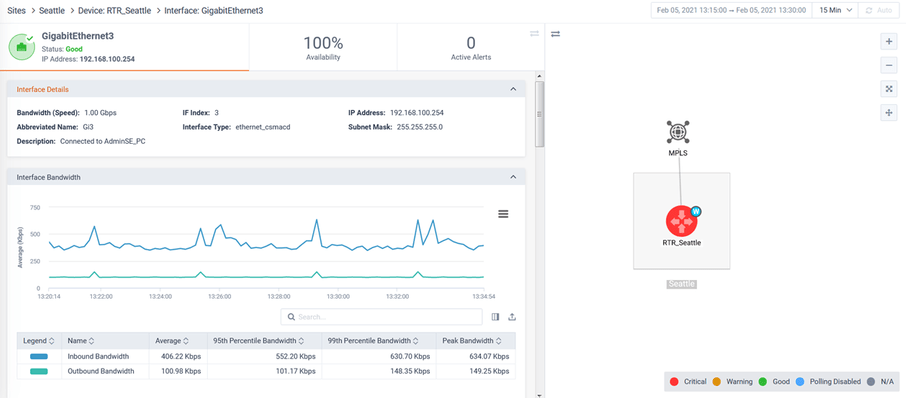
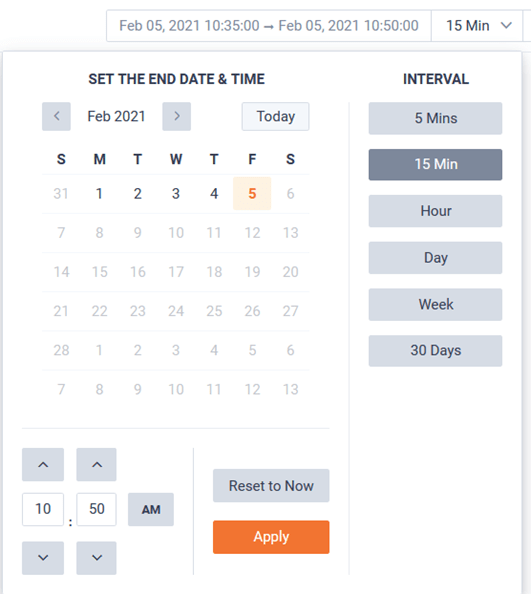
Historic data can be explored on the entity's tabs.
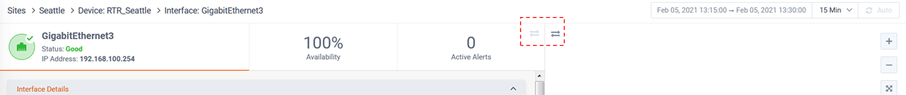
The page can optionally be auto-refreshed by toggling the button in the top right of the page.
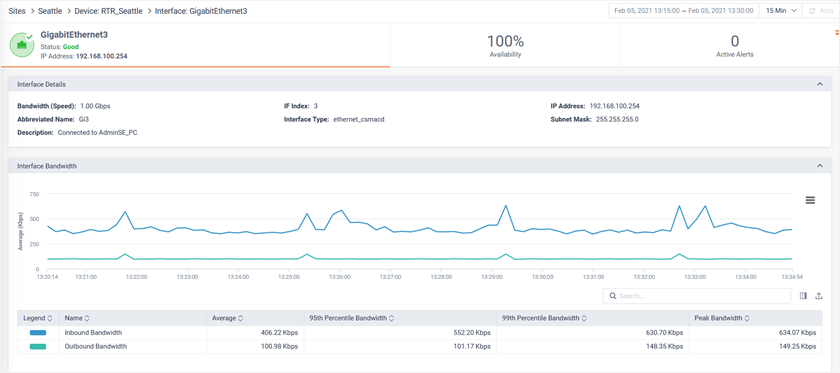
The page view can be modified to allow the tabs or topology to be full page.
Full page tab view:
Full page Topology view:
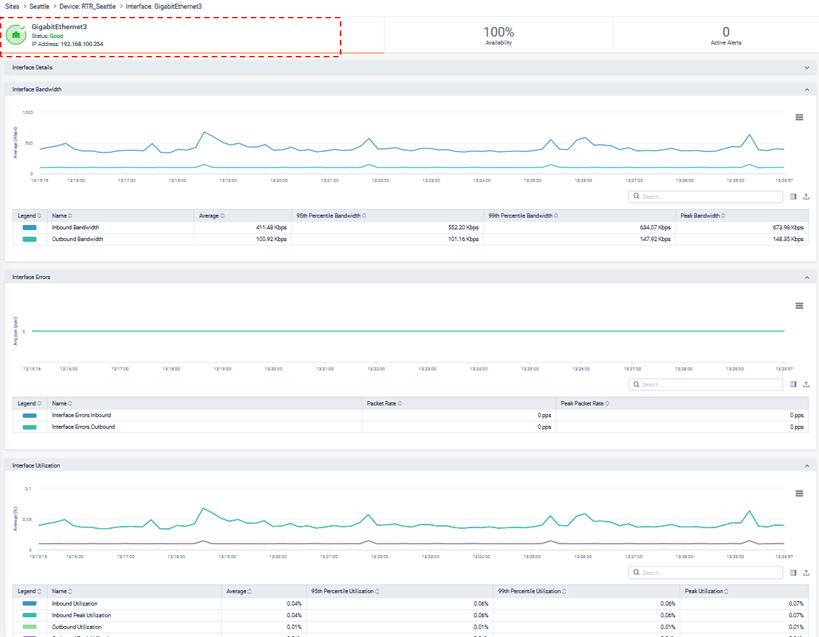
The status tab of the Interface page provides a curated list of reports for quick understanding of the Interfaces’ Status.
These reports include:
• Site Details
• Interface Bandwidth
• Interface Errors
• Interface Utilization
• Top Class Drops (Outbound)
• Top Application (Inbound)
• Top Application (Outbound)
• Top DSCP (Inbound)
• Top DSCP (Outbound)
• Top Conversation (Inbound)
• Top Conversation (Outbound)
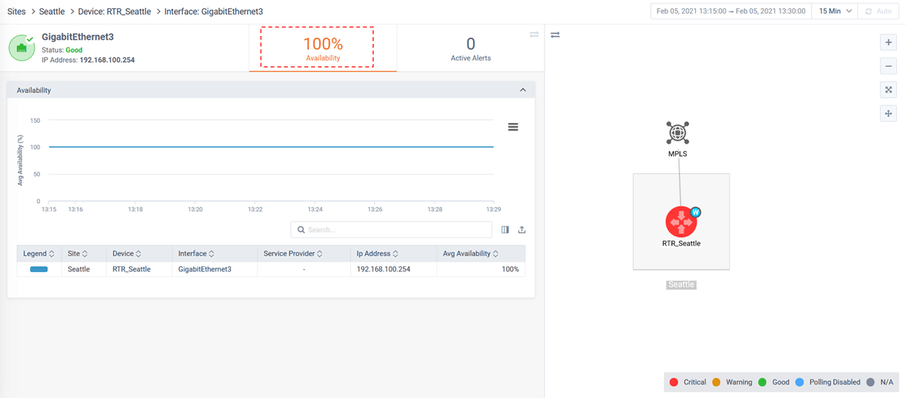
The Availability tab of the Site page provides the Sites Availability report.
The Active Alerts tab of the Interface page provides a list of all active Alerts on the Interface. Clicking on an Alert will drill-down into its details.